Revenue and costs
What came in, what went out, and which customers, jobs, products or sites drove both.
Need AI automation, cloud or managed IT?Book a free AI audit
or call0800 00 2270
Complimentary business assessment· NZ$999.95 stated value
Your business already holds the information. ForensiQ turns financial and operational records into a clear picture you can understand and act on.
An AI and machine-learning layer forecasts, ranks and explains what changed - every signal carries its model, confidence and evidence.
*Initial dashboard and assessment report within 24 hours of Click IT receiving the agreed, usable data and confirming scope. Alternative timeframes are confirmed for complex assessments.
 Illustrative demo — synthetic data
Illustrative demonstration using fictional synthetic data. Not a client result.
What ForensiQ does
ForensiQ is Click IT's AI business intelligence service for New Zealand businesses. It joins the financial and operational records you already keep, checks and reconciles them, then turns them into a private dashboard and plain-language findings - each one linked to the evidence behind it.
It is management analysis, not another dashboard to maintain. ForensiQ checks, joins and reconciles the records you already have, then shows what needs attention with the evidence attached.
ForensiQ supports owners, managers, accountants and finance teams. It does not automatically change your accounts, make decisions for you, or replace professional judgement.
What came in, what went out, and which customers, jobs, products or sites drove both.
Margin by the parts of the business that actually make or lose money - not one blended total.
When money arrived, when it left, and why profit and available cash can tell different stories.
Volumes, utilisation, turnaround and service delivery, joined to the financial result they explain.
Duplicates, split payments, out-of-pattern spending and bank-detail changes flagged for human review.
Gaps, mismatches and unreconciled records shown as missing - never quietly filled in.
Direction of travel across revenue, cost, margin, demand and receivables, with the evidence attached.
A short, ranked list of items worth a person's time, each linked back to the records behind it.
Operations dashboard library
Farm operations, livestock, milk production, feed, herd health and finance are usually held in six different systems. ForensiQ joins them, then puts an AI layer on top that explains what changed, what is likely next and which records support the call.
ForensiQ Operations Console
Waikato Ridge Dairy · synthetic demonstration
Pasture, tasks, water and machinery · Waikato Ridge Dairy · 312 ha effective
Daily operating picture: cover, growth, tasks, water and plant.
2,410 kg DM/ha
target 2,300 · +4.8%
AI forecast: 2,380 in 7 days
48 kg DM/ha/day
target 55 · -12.7%
AI flags 3 slow paddocks
14.2 t DM/day
demand 15.1 t DM/day
26
6 due today · 2 overdue
AI re-ordered by risk
68%
43,000 L of 63,000 L
AI leak check clear
$18,420
this month · +6.1% on plan
AI: pump 2 efficiency -14%
Synthetic plate-meter walk, 12 weeks to 30 Sep 2026
Open synthetic tasks this week
Synthetic farm weather station, mm
The growth forecast drops below herd demand after 22 Oct unless supplement is introduced. The model uses cover, growth, rotation length and the 7-day weather outlook.
Draft action: Draft a 4 t PKE order and a 60-cow runoff move for review.
Regrowth is 18% below the farm median for the third consecutive rotation. The pattern is flagged for agronomy review, not attributed to a cause.
Draft action: Add to the next soil-test and fertiliser review.
Flow per kWh has drifted below its own 90-day baseline. This is an equipment prompt, not proof of a fault.
Draft action: Book a service check before the 2 Nov irrigation run.
Signals are decision support only. Nothing is ordered, paid, treated or culled without a named person approving it.
Pasture growth forecast
7-day growth rate per paddock
MAE 2.1 kg DM/ha/day
Feed demand model
Herd demand and feed gap
MAPE 4.2%
Asset anomaly detector
Pump, irrigation and machinery outliers
Recall 0.89 · precision 0.74
Forecast cover is shown separately from the measured walk. A paddock flag is a prompt to look, never a diagnosis of soil, pasture or equipment.
Illustrative demonstration for a fictional Waikato dairy operation, built entirely from synthetic data. Figures are not benchmarks and are not a forecast for your business.
AI and machine learning, on purpose
AI is not a badge on the dashboard. Every forecast, risk score and anomaly in ForensiQ is produced by a named model, backtested on the client's own records, and shown with the confidence and evidence behind it. Where the data cannot support a model, ForensiQ does not pretend otherwise.
Records from farm, herd, milk, feed, health and finance are matched to the same animal, paddock, invoice or day.
Deterministic measures are reproduced from the joined records, with the calculation and source attached.
ForensiQ runs forecasts, detectors and classifiers that are relevant to that dataset - each with a published model card.
Signals arrive as a short, ranked list with confidence, evidence and a draft next step for a person to approve.
What is likely next, with an interval
Method: Gradient-boosted and seasonal models
In the dashboards: Milk yield, pasture growth, feed gap, cash position
Forecasts are shown separately from measured actuals, with the range and assumptions.
What moved outside its own normal
Method: Isolation forest, robust z-score, change-point detection
In the dashboards: Pump efficiency, duplicate payments, yield drops, lameness clusters
An anomaly is a prompt to investigate, never proof of fault or fraud.
Which records need attention first
Method: Gradient-boosted classifiers
In the dashboards: Mastitis early warning, condition risk, lameness likelihood
Rankings triage human review. No treatment, mating or culling decision is automated.
Turn a photo into a measured record
Method: Convolutional neural networks
In the dashboards: Body condition score, pasture cover from a plate-meter photo
Every score keeps the image and the assessor review alongside it.
Read the paperwork that never reaches a database
Method: Layout-aware OCR + LLM extraction
In the dashboards: Supplier invoices, vet visits, milk statements, rate cards
Field-level confidence is stored; low-confidence fields are queued for a person.
Show the records behind every number
Method: Structured retrieval over the client's own records
In the dashboards: The invoice, animal, paddock or payment behind a finding
A finding cannot be published without its supporting records attached.
Non-negotiable guardrails
Numbers first, models second
Every KPI is a deterministic calculation over the client's records. AI sits on top to forecast, rank and explain - it never invents a measured value.
Confidence shown, not implied
Each AI signal carries its model, confidence and evidence. Low-confidence output goes to a review queue instead of the dashboard headline.
A person decides
ForensiQ drafts actions - a feed order, a monitor mob, an invoice query. A named person approves anything that leaves the system.
Tested against the client's own history
Models are backtested on the client's records before use, with error metrics published next to the model card, and monitored for drift afterwards.
Industry demonstrations
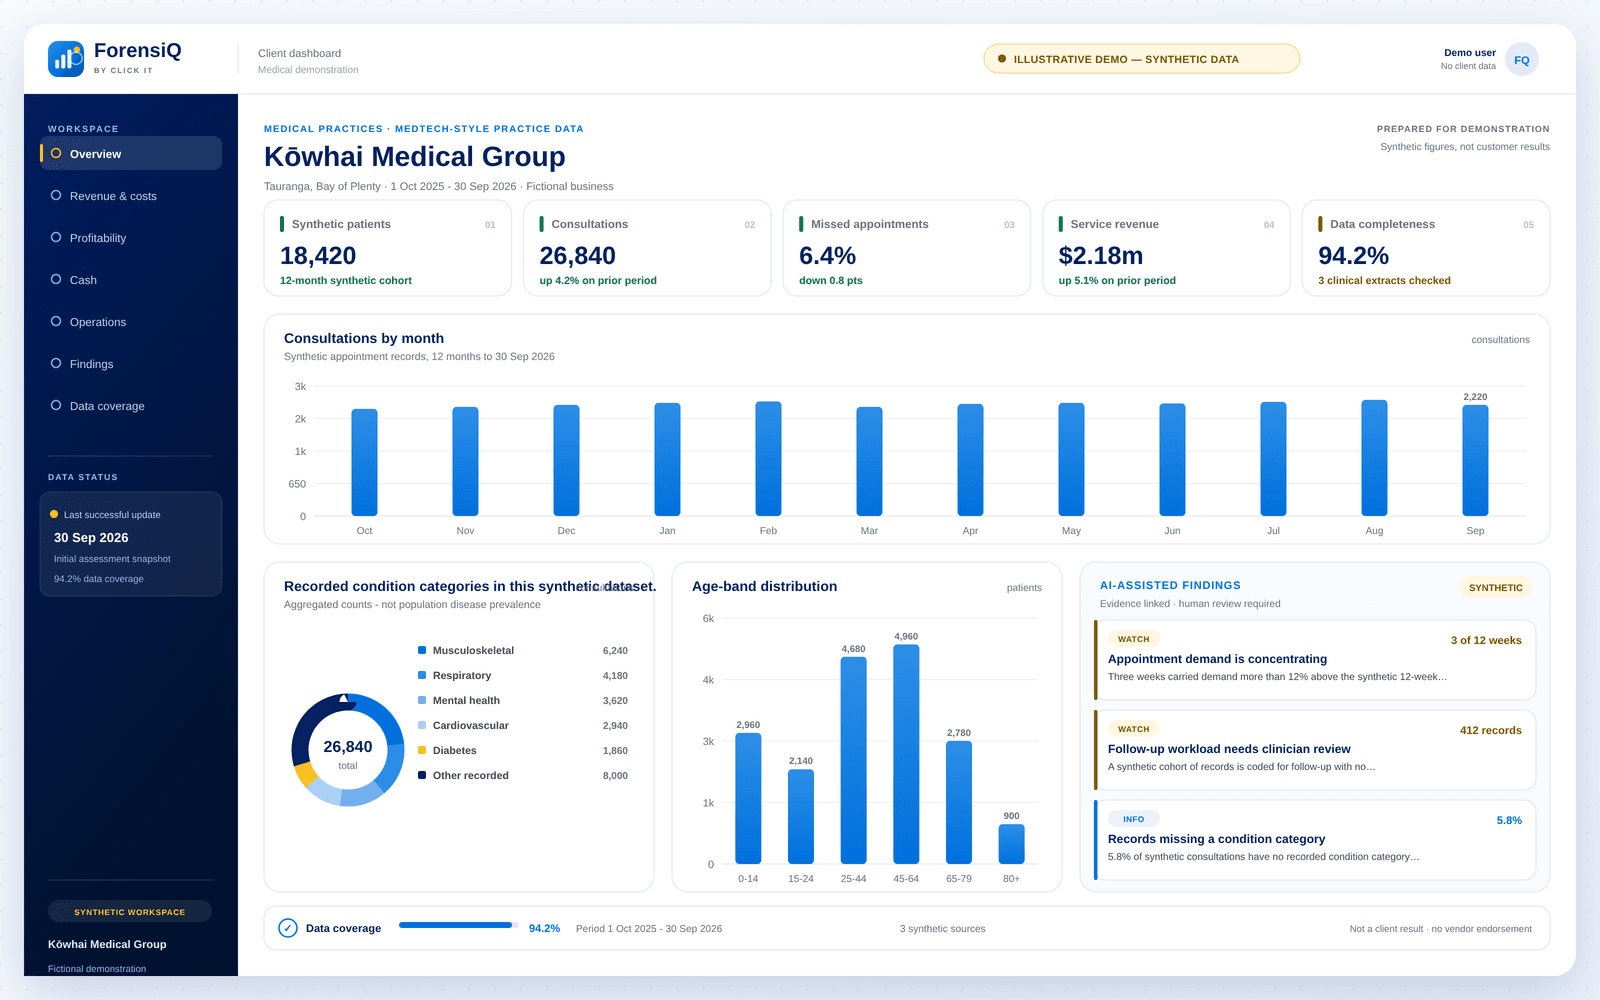
Ten distinct examples built from fictional, synthetic data. Each one shows a different dashboard composition, evidence-linked findings and a data coverage view. Open any example to filter the figures and see how the analysis would work.
Showing 10 of 10 demonstrations. All figures are fictional synthetic data.
Medtech-style practice data
Consultations, demand and recorded condition categories in one practice view.
Software examples
Medtech Evolution · Indici · MyPractice · Cliniko
Questions it answers
EXACT-style practice data
Chair time, treatment value and the money waiting to be collected.
Software examples
EXACT · Dentally · Dental4Windows · Open Dental
Questions it answers
OneLaw-style practice data
Work in progress, billing delays and matter profitability without privileged detail.
Software examples
OneLaw · Actionstep · LEAP · Clio · Infinitylaw · PracticeEvolve
Questions it answers
iCOS and EROAD-style data
Every truck, every kilometre and the jobs that quietly lose money.
Software examples
iCOS · EROAD · Teletrac Navman · MyTrucking · Samsara · Geotab
Questions it answers
Farm Focus and Figured-style data
Production, feed cost and seasonal cash pressure in one farm view.
Software examples
Farm Focus · Figured · FarmIQ · MINDA · DairyComp · AgriWebb
Questions it answers
MYOB and Xero-style ledger data
Profit, cash and the reconciliation differences between them.
Software examples
Xero · MYOB · QuickBooks · Sage
Questions it answers
Simpro, Fergus and Tradify-style data
Job margin, variations and materials traced back to the job.
Software examples
Simpro · Fergus · Tradify · ServiceM8 · Buildxact
Questions it answers
Shopify, WooCommerce and Cin7-style data
Margin by product, channel and return - after the fees.
Software examples
Shopify · WooCommerce · Cin7 Core · Lightspeed · Square
Questions it answers
Lightspeed and Square-style data
Daily sales, food cost and staffing across two locations.
Software examples
Lightspeed Restaurant · Square · Oracle MICROS · Toast · MarketMan
Questions it answers
Business Central, SAP and NetSuite-style data
Production, yield and material variance by product line.
Software examples
Microsoft Dynamics 365 Business Central · SAP Business One · Oracle NetSuite · Odoo · SYSPRO
Questions it answers
These are illustrations of how ForensiQ analysis could look. They are not client results, completed projects or vendor endorsements. Interfaces shown are ForensiQ's own; product names indicate potential data sources only.
Complimentary assessment
Your own dashboard. Clear findings. No obligation to buy.
Value is shown for context. No previous selling price or discount is implied.
Receive your initial dashboard and assessment report within 24 hours of receiving the agreed, usable data and confirming the assessment scope.
Complex assessments - for example multiple entities, restricted access, poor data quality or a large data volume - may need longer. We will confirm an alternative timeframe in writing before work starts.
Included scope
01
Initial business discussion
A short conversation about the business, the questions that matter and what you already have.
02
Agreed assessment scope
We write down what will be reviewed, which questions it answers and what sits outside it.
03
Confidentiality and NDA arrangements
Confidentiality is agreed before source data is shared. A mutually executed NDA is available on request.
04
Review of agreed available data
We review only the records in scope, using the access or export method agreed with you.
05
Initial private dashboard
Your own secure dashboard, with source references and calculation detail. Included access: 14 days from delivery of the initial dashboard.
06
Initial findings report
Verified calculations, potential anomalies, missing information, assumptions and suggested next steps, clearly separated.
07
Results discussion
We walk through the findings with you and answer questions. No obligation to continue.
Included dashboard access: 14 days from delivery of the initial dashboard. Ongoing hosting, refreshes and support require an agreed arrangement.
The initial dashboard and report are delivered within 24 hours of receiving agreed, usable data and confirming scope. Complex assessments may need an alternative timeframe, confirmed in writing.
Included private dashboard access is 14 days from delivery of the initial dashboard. Ongoing hosting, daily refreshes, support and further analysis require a separate agreed arrangement.
The complimentary assessment is a defined first review, not unlimited analysis, perpetual hosting or ongoing daily monitoring.
The NZ$999.95 value is Click IT's stated assessment value. The campaign assessment is provided at no charge; no previous selling price or discount is implied.
How ForensiQ works
Six steps from first conversation to a private dashboard and findings report. Scope, confidentiality and the limits of the data are agreed before source records move.
We talk through what you want to understand and whether ForensiQ is the right fit.
Scope, data, access, timing, confidentiality and assessment consent are agreed before source records move.
We use an agreed secure transfer method, approved export, or read-only authorised access where practical.
Records are inventoried, normalised, checked for duplicates and completeness, matched across systems and reconciled.
Your private dashboard opens with the initial findings report, source references and stated limitations.
We review the findings together. You decide whether anything further is useful - with no obligation.
Exact calculations are reproducible and linked to the supporting records.
Verified calculations, potential anomalies, missing information, assumptions and forecasts are reported separately.
We do not invent model performance, algorithm names or guaranteed accuracy. Where a model is used, its limits are stated.
Reported separately
Verified calculations · potential anomalies · missing information · assumptions · forecasts and uncertainty.
Supported software
ForensiQ is designed to work with the systems New Zealand businesses already run - practice management, accounting, operations, industry platforms and plain spreadsheets.
89 systems and data sources listed. Access is confirmed during scoping.
Access methods vary by system. We assess available exports, reports, approved APIs, or authorised database access during scoping. Listing a system is not a promise of universal access or an implemented native connector.
Don't see your software listed? Tell us what you use. We'll identify the available options for working with your data.
You don't need to understand your database or technical setup. We'll work through that with you.
Product names and marks belong to their respective owners and indicate potential data sources only. They do not imply partnership, sponsorship, endorsement or that a native connector already exists for every system.
New Zealand wide
ForensiQ is run by Click IT's data and AI team in Tauranga. Assessments are scoped and delivered remotely for businesses anywhere in New Zealand. Where a conversation is easier in person, we are based in Tauranga and work across the Bay of Plenty and Waikato.
There is no new accounting platform to migrate to. We read the New Zealand systems businesses already run - Xero, MYOB, Farm Focus, Figured, iPayroll, practice management and industry platforms - plus the SQL databases, exports and spreadsheets that hold the rest of the picture.
Privacy is part of the scope, not an afterthought. Personal information is handled under the New Zealand Privacy Act 2020, access is role-based and logged, and where an assessment involves health or other sensitive records the agreed scope states how that information is minimised, aggregated or suppressed before analysis.
Xero, MYOB, Farm Focus, Figured, iPayroll, practice management and industry platforms - plus SQL databases, exports and the spreadsheets that hold the rest.
Personal information is handled under the New Zealand Privacy Act 2020, with data minimisation, role-based access, audit logging and agreed retention.
Your records stay in your systems. Where a system supports it, we use authorised read-only access instead of write access.
Scoped and delivered from Tauranga by Click IT's data and AI team, in New Zealand business hours, working directly with you.
Confidentiality and privacy
An unlisted web address is not access control. Customer information is protected by separate technical and contractual controls, not by the obscurity of a link.
Records are processed only for the assessment purpose and scope agreed with you in writing.
We ask for the fields needed to answer the agreed questions - not whole databases by default.
Source data moves through an agreed secure method. We do not ask for source documents in the initial web form.
Access is limited to the Click IT people working on your assessment, with role-based controls and audit logging.
Where a system supports it, we use read-only authorised access rather than write access.
Retention is agreed before work starts. Data is deleted or returned on the agreed schedule, subject to legal obligations.
Any third-party processing is identified and approved before data is shared, and remains within the agreed purpose.
Privacy questions and access or correction requests can be sent to info@click-it.co.nz.
Click IT publishes its current ISO/IEC 27001 certification information on its ISO/IEC 27001 page. Certification status, certified entity and scope should be confirmed against the current certificate before being relied on. This campaign does not add a broader certification claim.
Secure client access
Review performance, understand where money goes, and see what needs attention in one private view.
Track daily performance when your agreed data connection is refreshed daily. Every dashboard shows its last successful update.
Your private dashboard
Authorised users only
Initial assessment snapshot
not live
30 Sep 2026 · 4:12 pm NZST
shown on every view
94.2% of agreed fields
limitations listed
This business only
server-enforced
Example layout only. A real dashboard shows the client's own approved data after activation.
Questions
If something is unclear, ask us. We would rather answer a question up front than have you rely on an assumption.
ForensiQ is Click IT's business data analysis and intelligence service. It joins financial and operational records, checks and reconciles them, then presents a private dashboard and plain-language findings. It helps management understand performance; it does not replace professional judgement.
Yes. The Complimentary ForensiQ Business Assessment has no assessment fee. The included scope and the dashboard access period are stated up front. Click IT's stated assessment value is NZ$999.95; no previous selling price or discount is implied.
No. There is no automatic subscription, no obligation to purchase further services and no ongoing service contract required. Confidentiality and assessment consent still apply.
The 24-hour period begins when Click IT has received the agreed, usable data and has confirmed the assessment scope in writing. It does not begin when the enquiry form is submitted. Complex assessments may need a longer, separately confirmed timeframe.
Practice management, accounting, payroll, operational, industry and data systems - for example Xero, MYOB, EXACT, Medtech, OneLaw, Simpro, Shopify, Lightspeed and SQL databases. Access depends on the system and the method available, which we confirm during scoping.
Tell us what you use. We will identify the available options for working with the data. A system not being listed does not mean it cannot be assessed, and being listed is not a promise of a native connector.
Yes, where the spreadsheet is a usable record of the agreed data. We assess structure, completeness and consistency during scoping. Excel, Google Sheets, CSV and appropriate PDF or document exports are common starting points.
No. ForensiQ is management analysis that sits alongside your accountant or adviser. It is not a statutory audit, tax return, legal opinion or assurance engagement.
No. ForensiQ does not automatically change accounts. Where read-only access is available, we use it. Any write access would require a separate explicit agreement and is not part of the complimentary assessment.
Yes. Confidentiality is arranged before source data is shared. The approved Click IT NDA may need to be supplied and executed by both parties. The NDA page in this campaign contains a clearly labelled draft for review, not an executed agreement.
No. Every showcase uses fictional, synthetic data and is visibly labelled as an illustrative demo. The images are not client results, completed projects or vendor endorsements.
Yes, if the assessment proceeds. The initial private dashboard is part of the complimentary assessment, with access limited to authorised users of your business. Access is activated after approval and identity checks.
Only if a daily data connection is agreed and working. Every dashboard shows its last successful update and whether it is a live connection, scheduled refresh, manual upload or initial snapshot. Stale data is never labelled live.
The complimentary assessment includes initial private dashboard access for 14 days from delivery of the initial dashboard. Ongoing access, refreshes, hosting and support require a separate agreed arrangement and are not included automatically.
We report missing or inconsistent information as a finding. We do not invent replacement figures. Some questions may remain unresolved until the missing records are supplied or the scope changes.
We discuss the findings and next steps. You may choose to continue with further analysis, a monitoring arrangement, or nothing at all. There is no obligation and no automatic subscription.
A clearer first step
Request the complimentary assessment. We will confirm scope, confidentiality and the data needed before anything is connected.
Receive your initial dashboard and assessment report within 24 hours of receiving the agreed, usable data and confirming the assessment scope. Dashboard access: 14 days from delivery of the initial dashboard. No assessment fee, no automatic subscription and no obligation to purchase further services.
Let’s talk
A repair, a migration, a security gap or an AI project - describe it in plain words and we will tell you honestly what it takes.